The Economics of the Frontier · Part 1 · July 2026
Does marginal intelligence capture all the value?
Open models now reach ~95% of frontier capability at a fraction of the price, and the popular conclusion is that the frontier premium is doomed. We measured where the money actually goes on the largest public AI model marketplace. Climbing one point on our capability index earns a frontier model an roughly an extra $3M a month and a mid-pack model under $100k, and the position it buys melts within weeks unless the lab re-earns it.

Will open models win, or closed?
Strip the tribalism and a more precise question sits underneath: is there a premium for being slightly more intelligent, or does most work have an intelligence ceiling: a level of capability past which buyers stop paying for more, and models compete only on price?
The ceiling story is having its moment. GLM-5.2 and Kimi K2.6 ship weights you can download, score within a few points of the frontier, and cost 80–95% less. Run it yourself, keep your data, keep your margin. Why pay a closed lab for the last few points?
This is a complex question and one article will not settle it. This piece, part one of a series, does one narrow thing. It takes sixteen months of weekly per-model token volumes from OpenRouter, the largest public marketplace where developers buy access to hundreds of models, cross-checks them against an enterprise gateway that reports real billed dollars, and asks which models get the tokens and which get the money.
Method, briefly: weekly token volumes from OpenRouter's public rankings (69 weeks; shares are of the ranked set, a median of ten models a week); dollars imputed at list, a disclosed limitation, so revenue claims are class-level, with Portkey's real billed dollars as the check. Capability is our IRT index, each model at its best-scored configuration, top slugs hand-audited. Full limits at the bottom.
Tokens left. Dollars right.
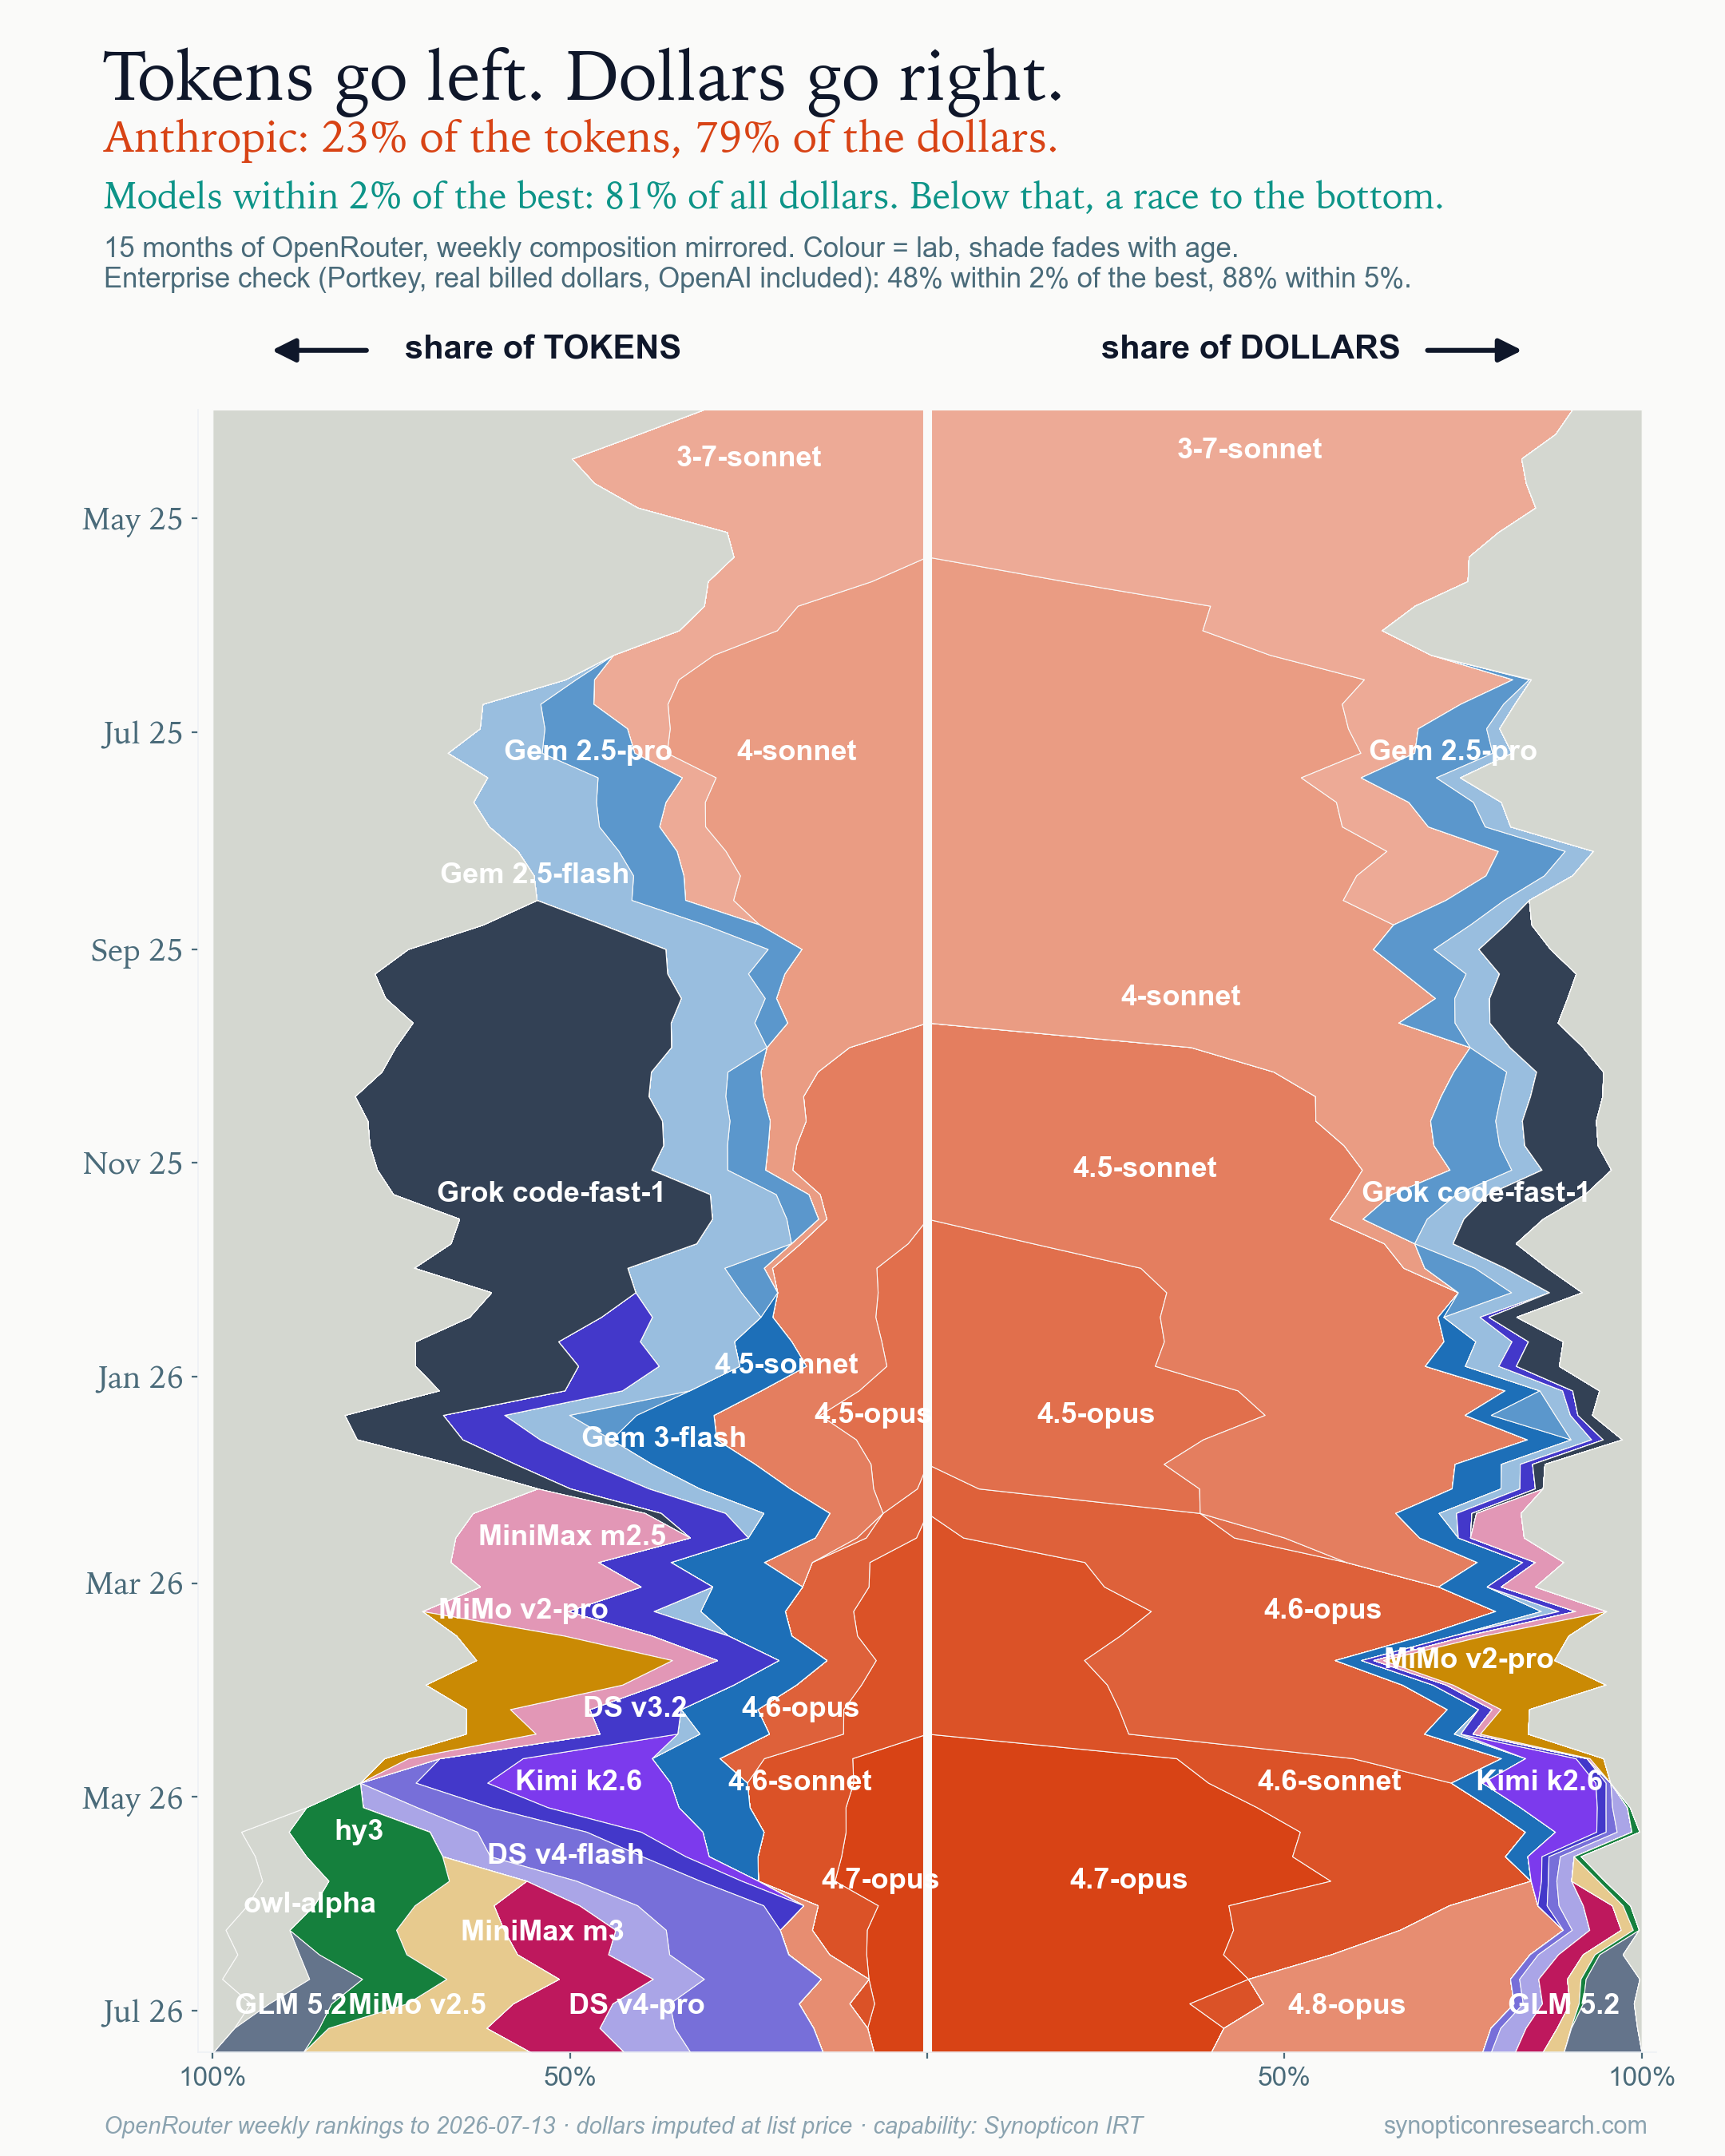
Both sides of the argument are on this one chart. One note on whose money this is: OpenRouter traffic is developer traffic, skewed toward coding agents and consumer chat apps; the enterprise check further down exists because of that skew. The left wing is the ceiling story, and it is real: most tokens run on cheap, good-enough models, and that market is brutal. Five price-performance champions in sixteen months, each eating the last. The right wing is what the ceiling story misses: the money barely moves between labs. Anthropic collects 77% of the dollars on 20% of the tokens, and it has done so through six straight flagship handoffs, Sonnet 3.7 through Opus 4.8, while the winners on the left churn.
Efficiency wins volume. Capability wins money.
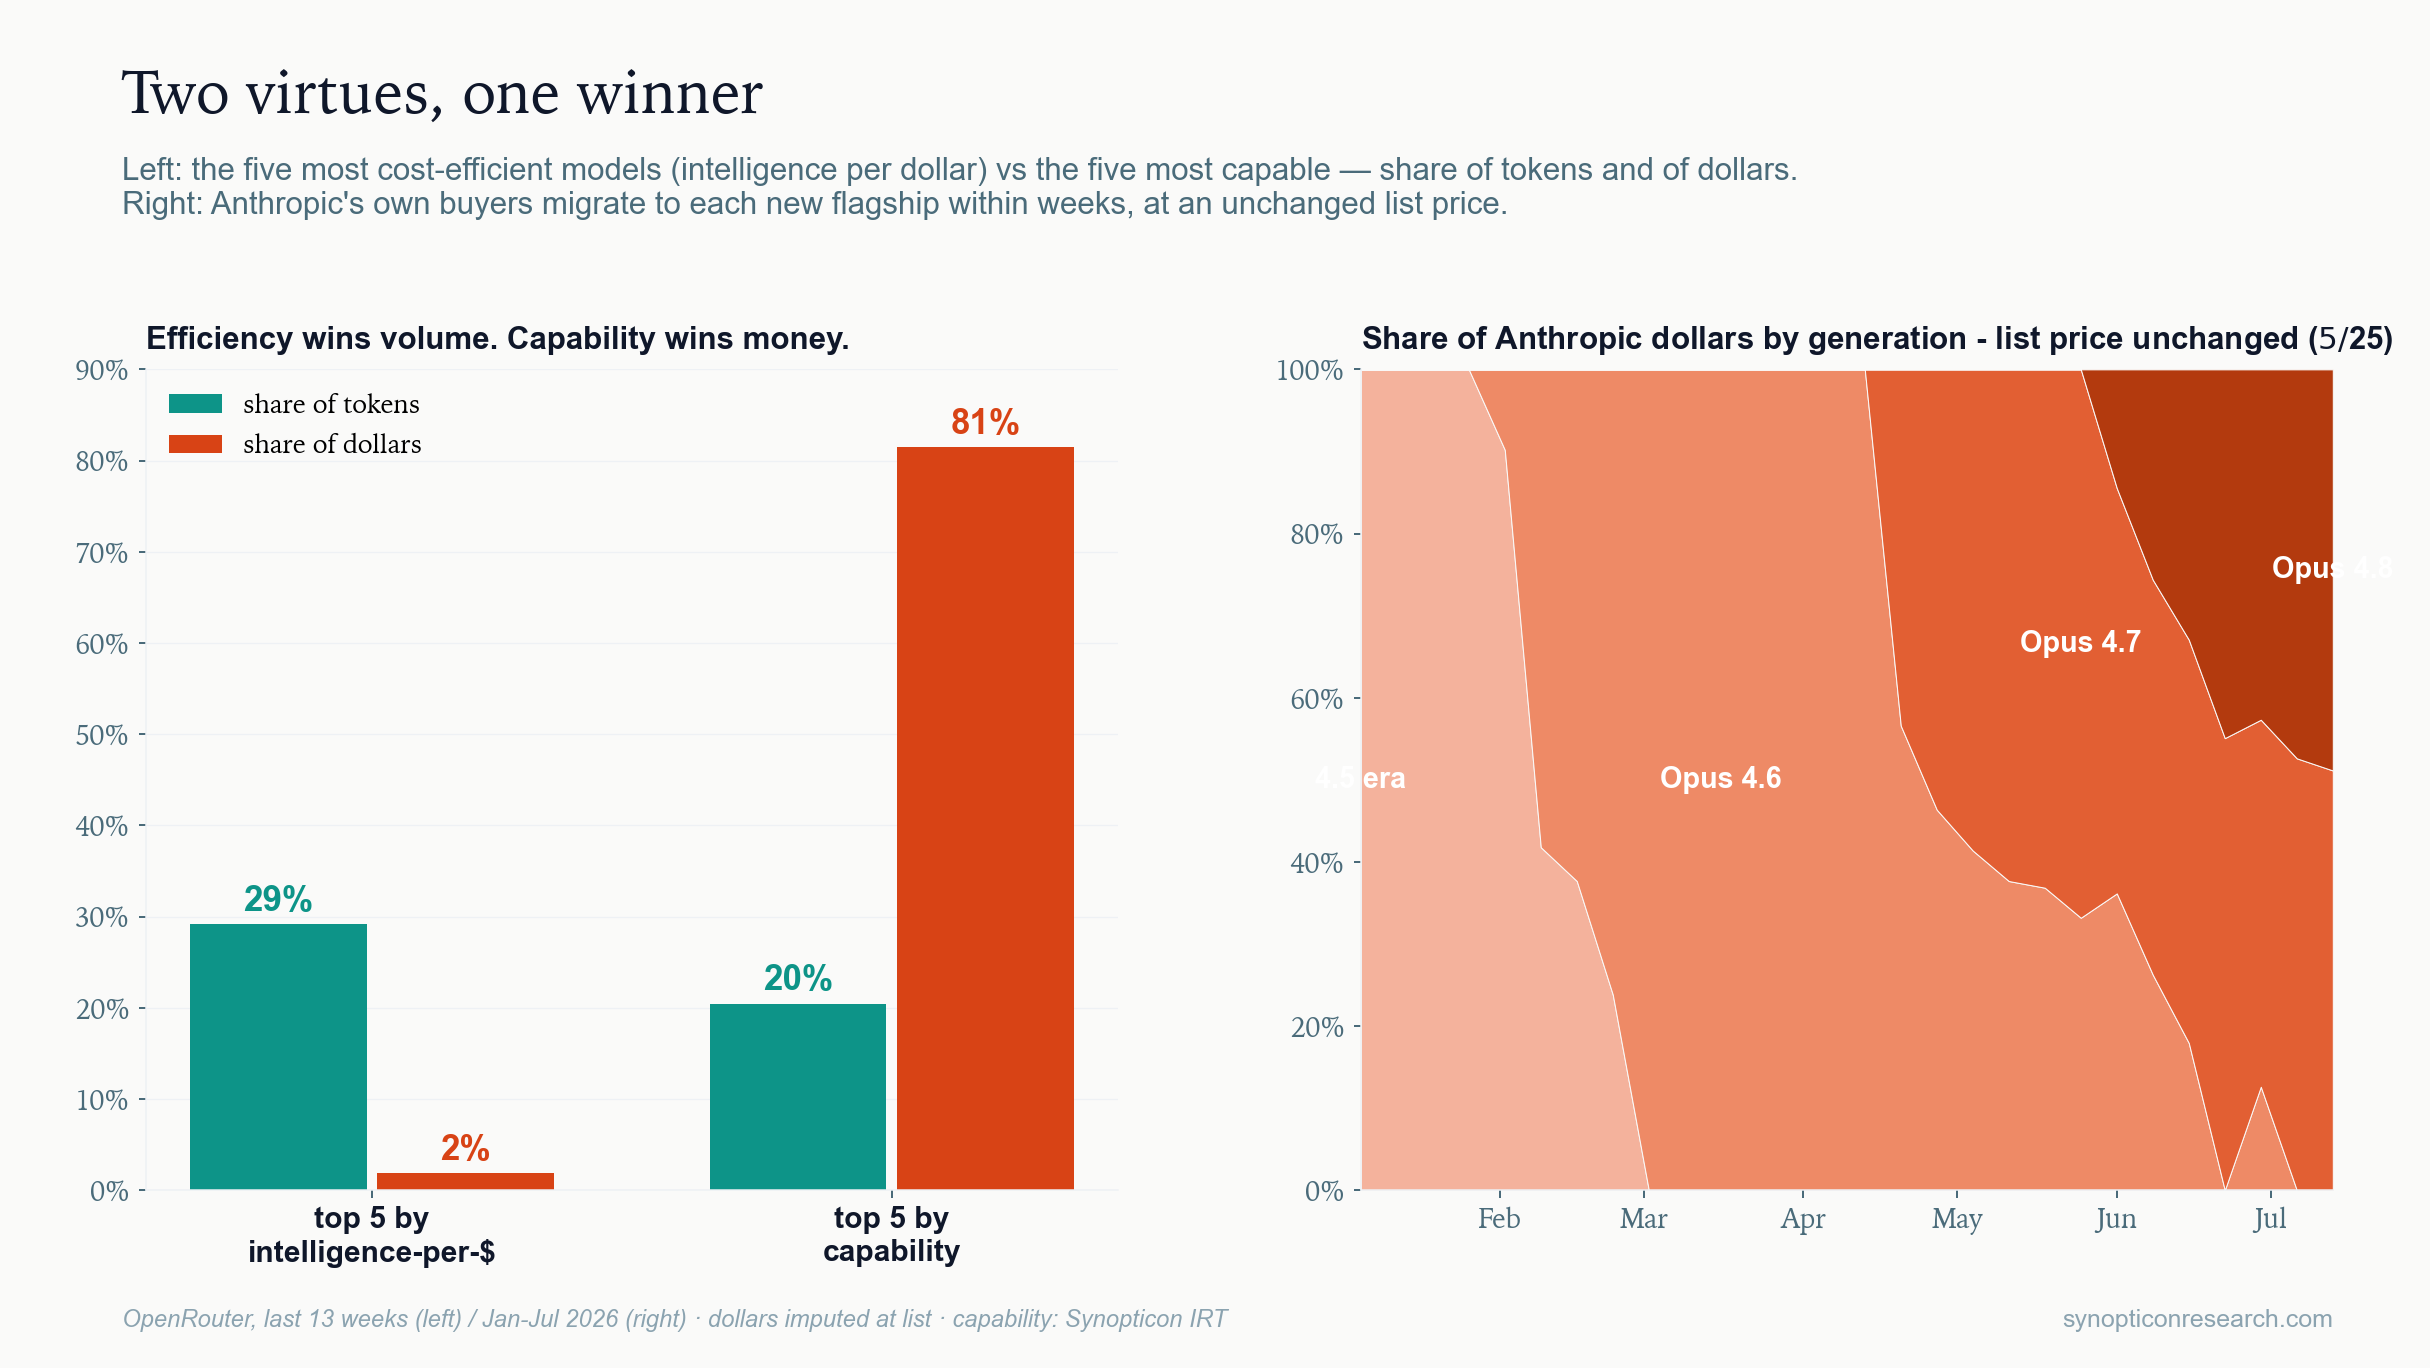
If buyers optimised for intelligence per dollar (capability points per dollar of blended token price), the most efficient of the ranked models would earn the most. They earn almost nothing: the five best ranked models by that ratio move 30% of tokens and collect 2% of dollars. The five most capable collect 82%.
The right panel is the cleanest natural experiment in the dataset. Anthropic has held Opus list price fixed at $5/$25 across three generations, so when a smarter flagship ships the only thing that changes is the intelligence. Buyers migrate within weeks, every time. If Opus 4.7 had been good enough for the work, there would be no reason to pay the same price for 4.8. They move anyway, every generation.
Below the frontier, capability is worthless
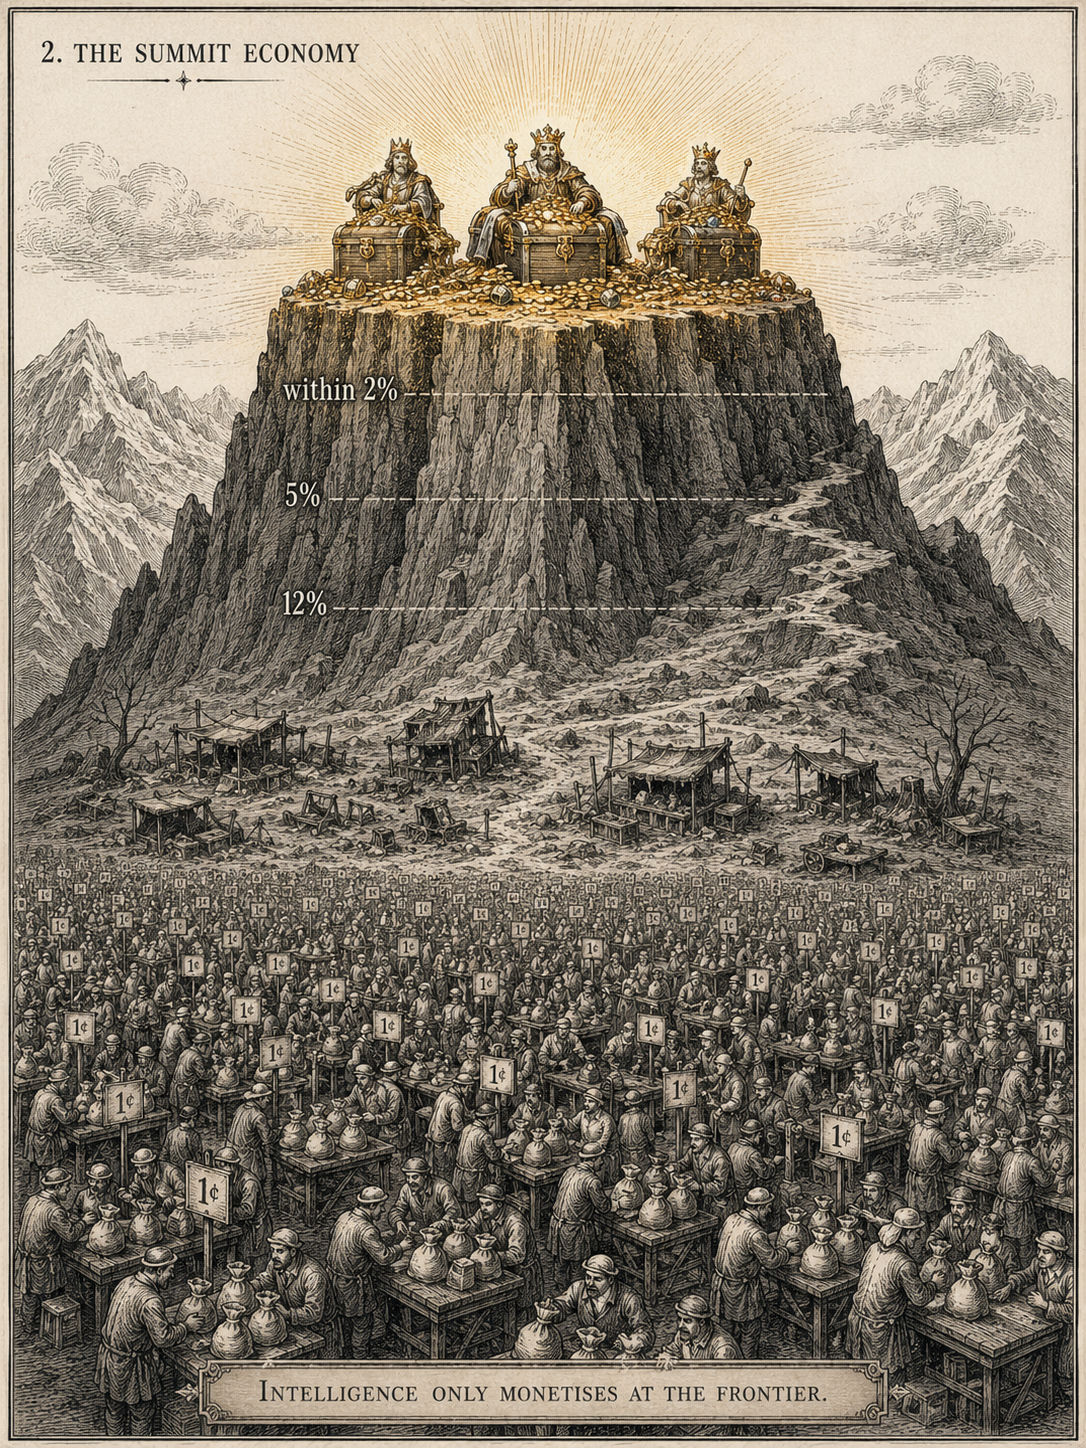
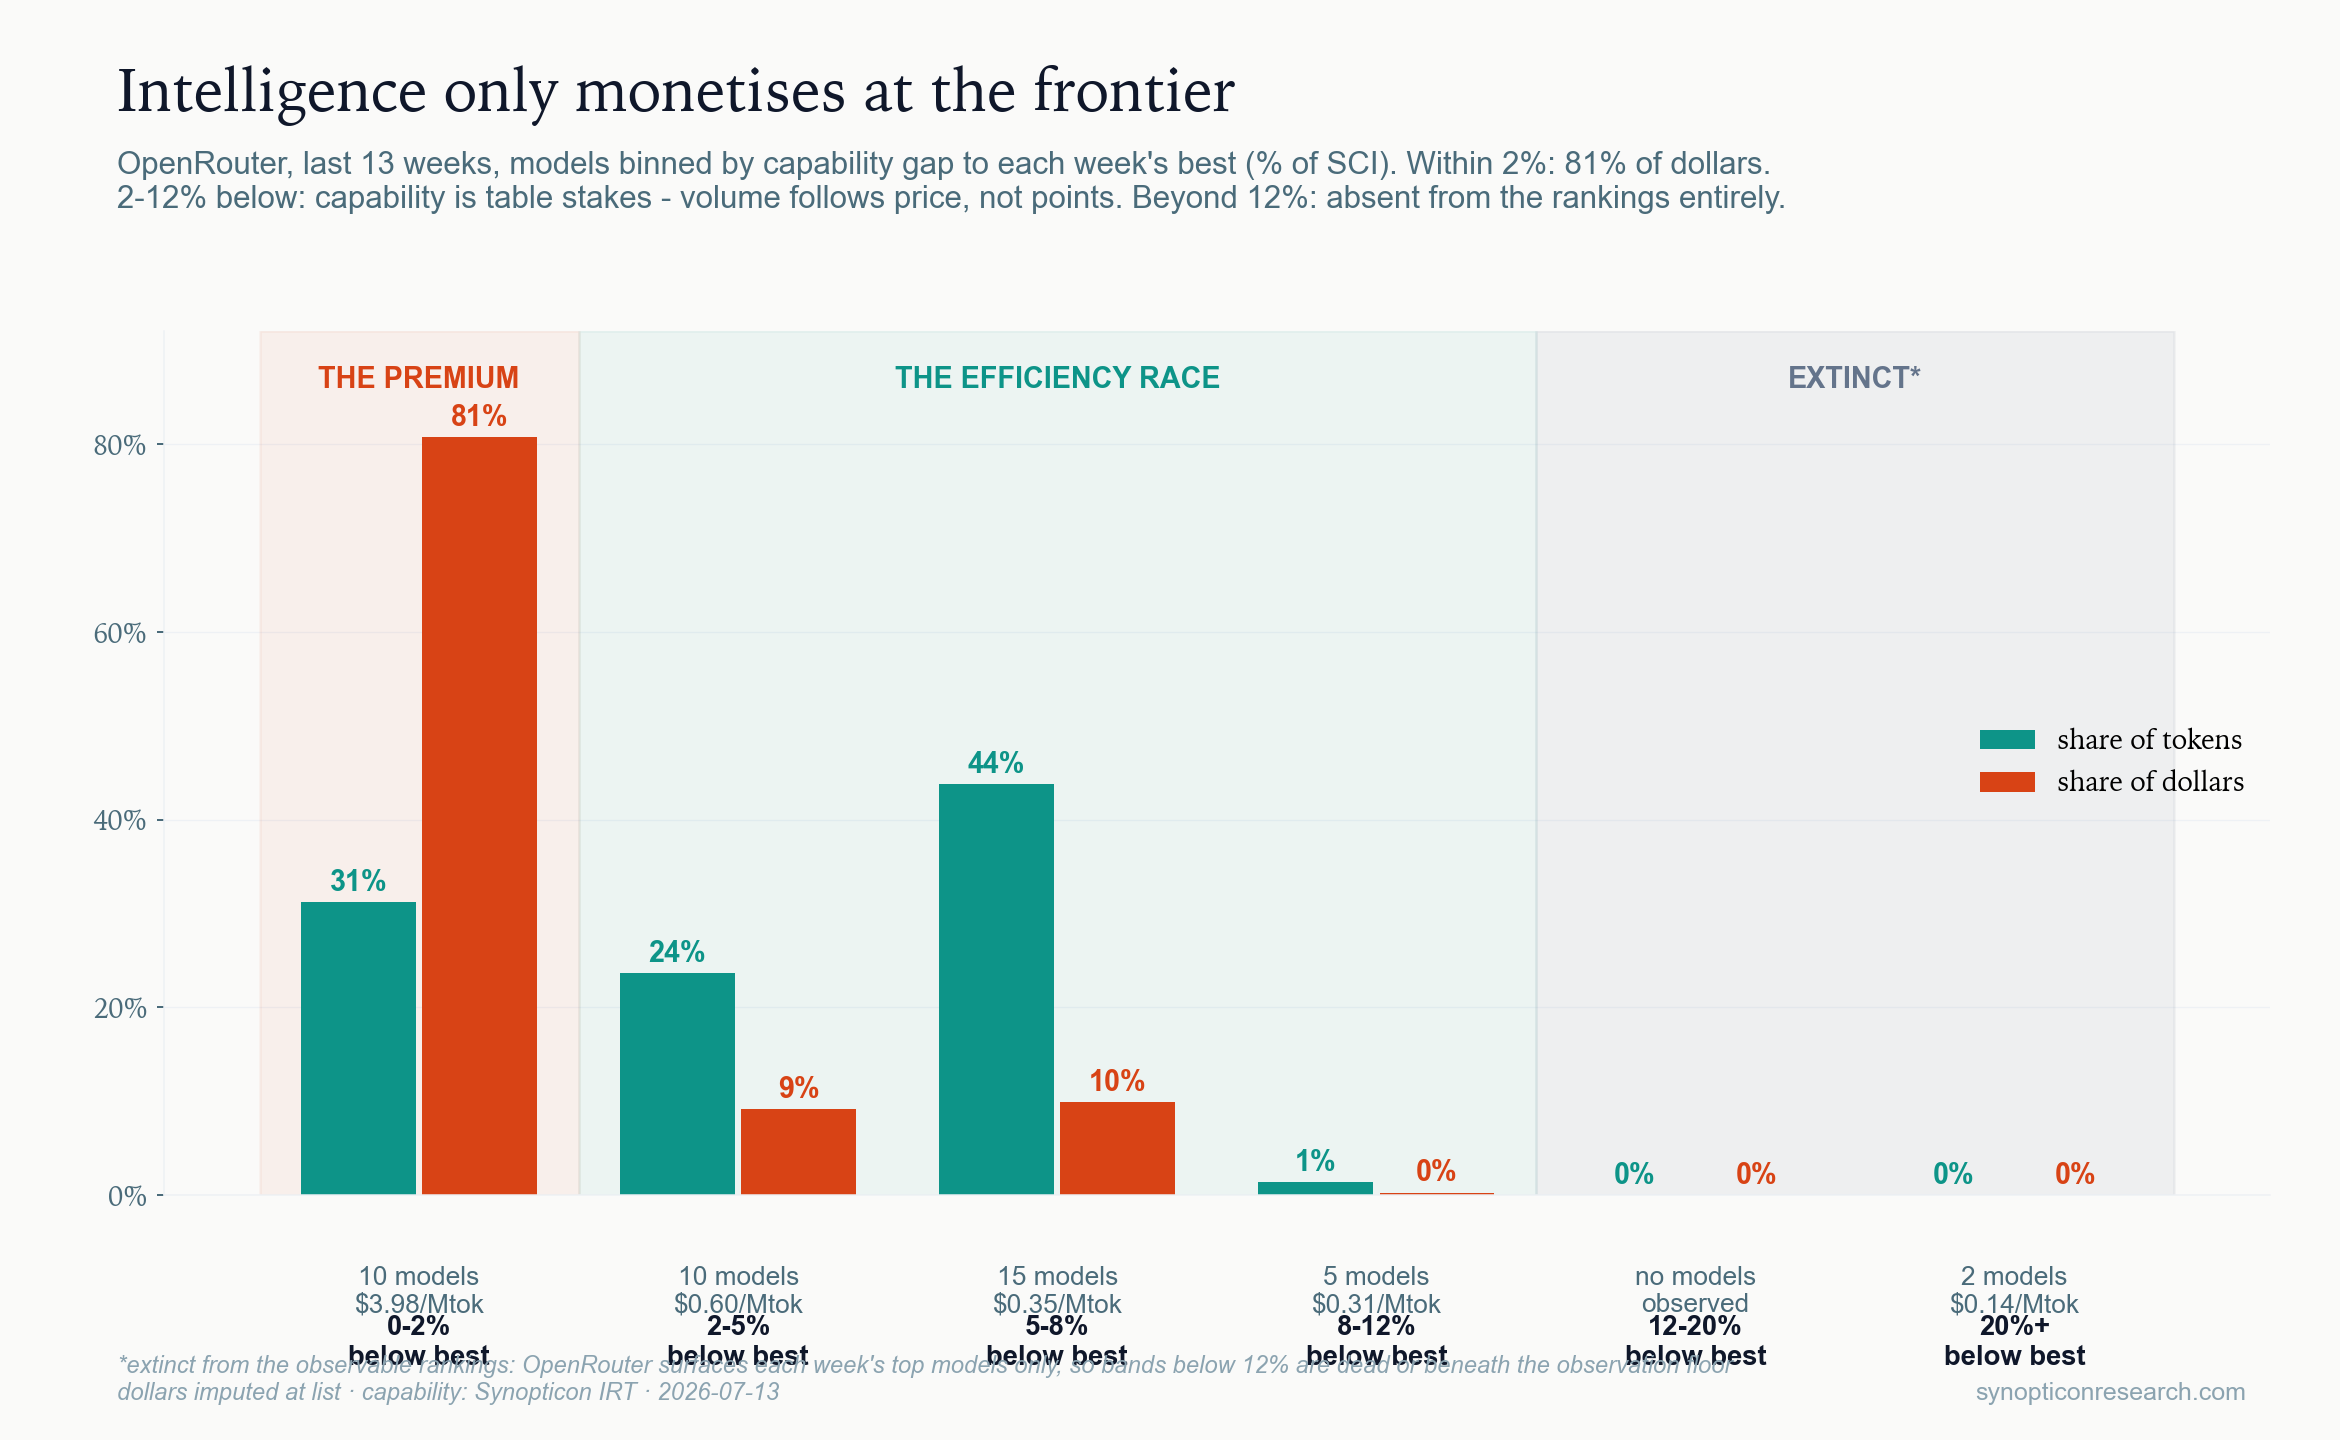
The market has three regimes. Within 2% of the week's best score on our capability index: 81% of all dollars, at $3.99 per million tokens. From 2% to 12% below: thirty models grinding at $0.31–0.61 per million, where volume tracks price and not capability (the correlation is effectively zero). Beyond 12%: the 12-20% band is empty, and only two stragglers survive past 20%, at $0.14 per million tokens.
So yes, the intelligence ceiling exists — for tokens. Most work, by volume, runs on good-enough models. But in the good-enough zone capability is table stakes: below roughly 88% of the frontier score the rankings are nearly empty, and nobody pays a premium for more capability until a model crosses roughly 98%. Sellers in the middle still list capability premiums; buyers demonstrably do not pay them. That unpaid premium is what the race to the bottom looks like from the inside.
What one point pays
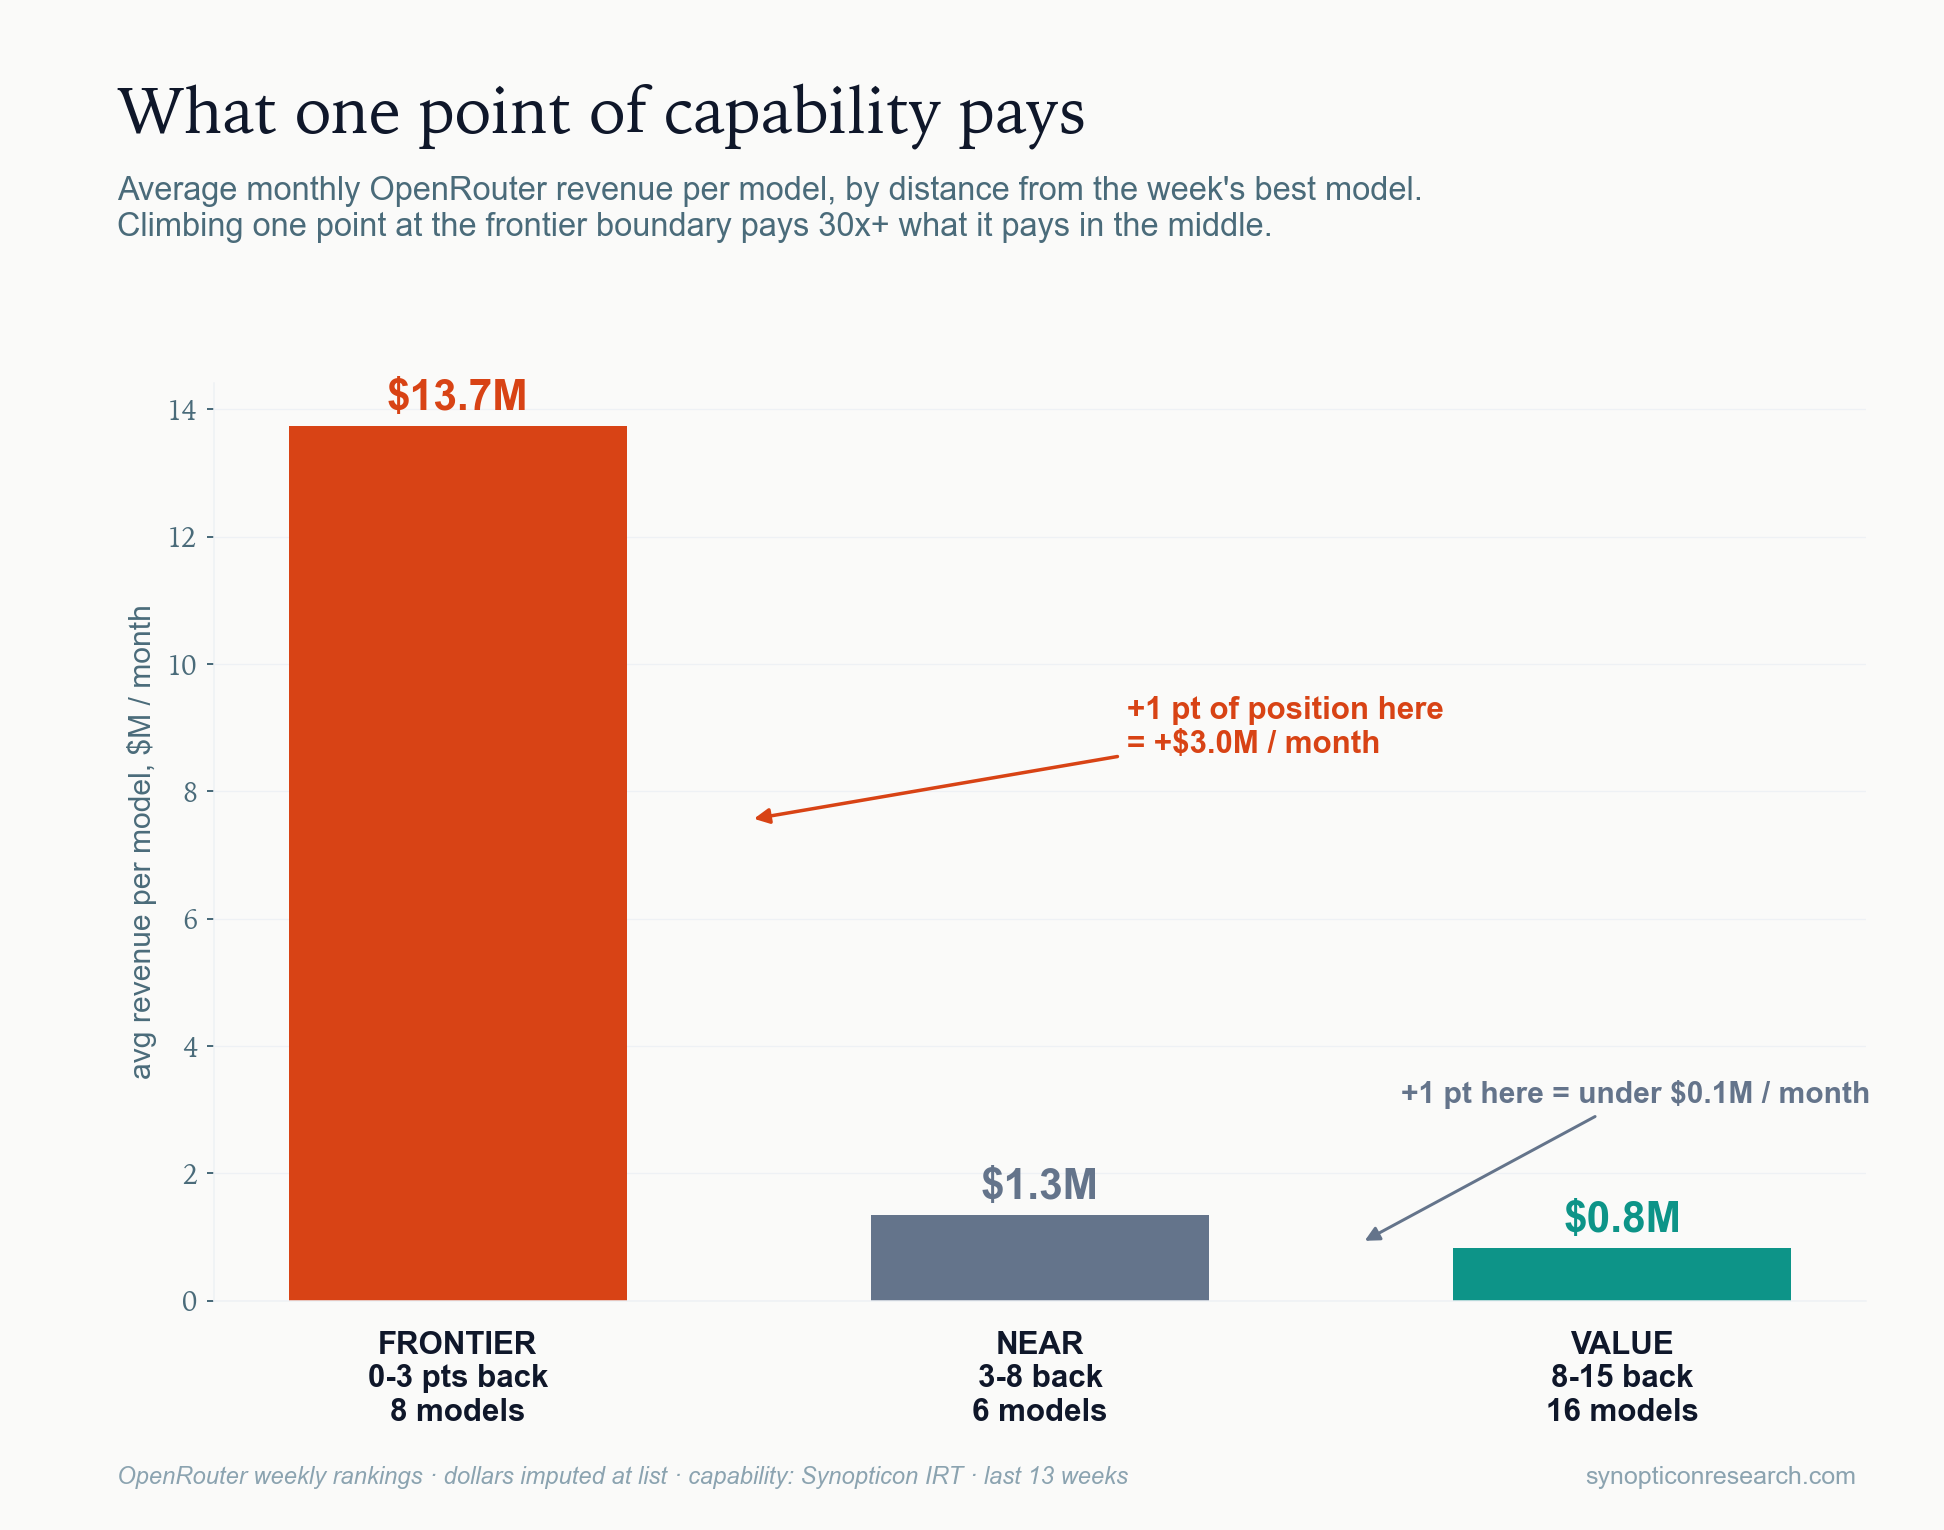
Put dollar figures on the thresholds. A frontier-band model averages $13.7M a month on OpenRouter; three to eight points back, $1.3M; the volume band, $0.8M. Climbing one point of position at the frontier boundary is worth about $3M a month. The same point in the middle of the pack is worth under $100k: at least a thirtyfold difference for the identical unit of progress. Within each band the slope is flat: points pay only at the crossings.
This is the hedge-fund-manager structure of intelligence pricing: a manager 1% better than the field does not earn 1% more; she earns the allocation. Labor economics has a name for the shape: the superstar market (Rosen, 1981), where a small quality edge captures the whole audience. Human pay draws the same curve, with within-occupation pay spread running from 1.3x for postmasters to 9x for actors and musicians. The token market is repeating the wage structure of the most unequal human professions; that mirror is a piece of its own. And it replicates on real money: Portkey, an enterprise gateway that reports the real billed spend of 200+ companies, tiers the same way at $6.9M, $2.9M and $0.69M per model per month. Ten to one, zero imputation.
The premium melts
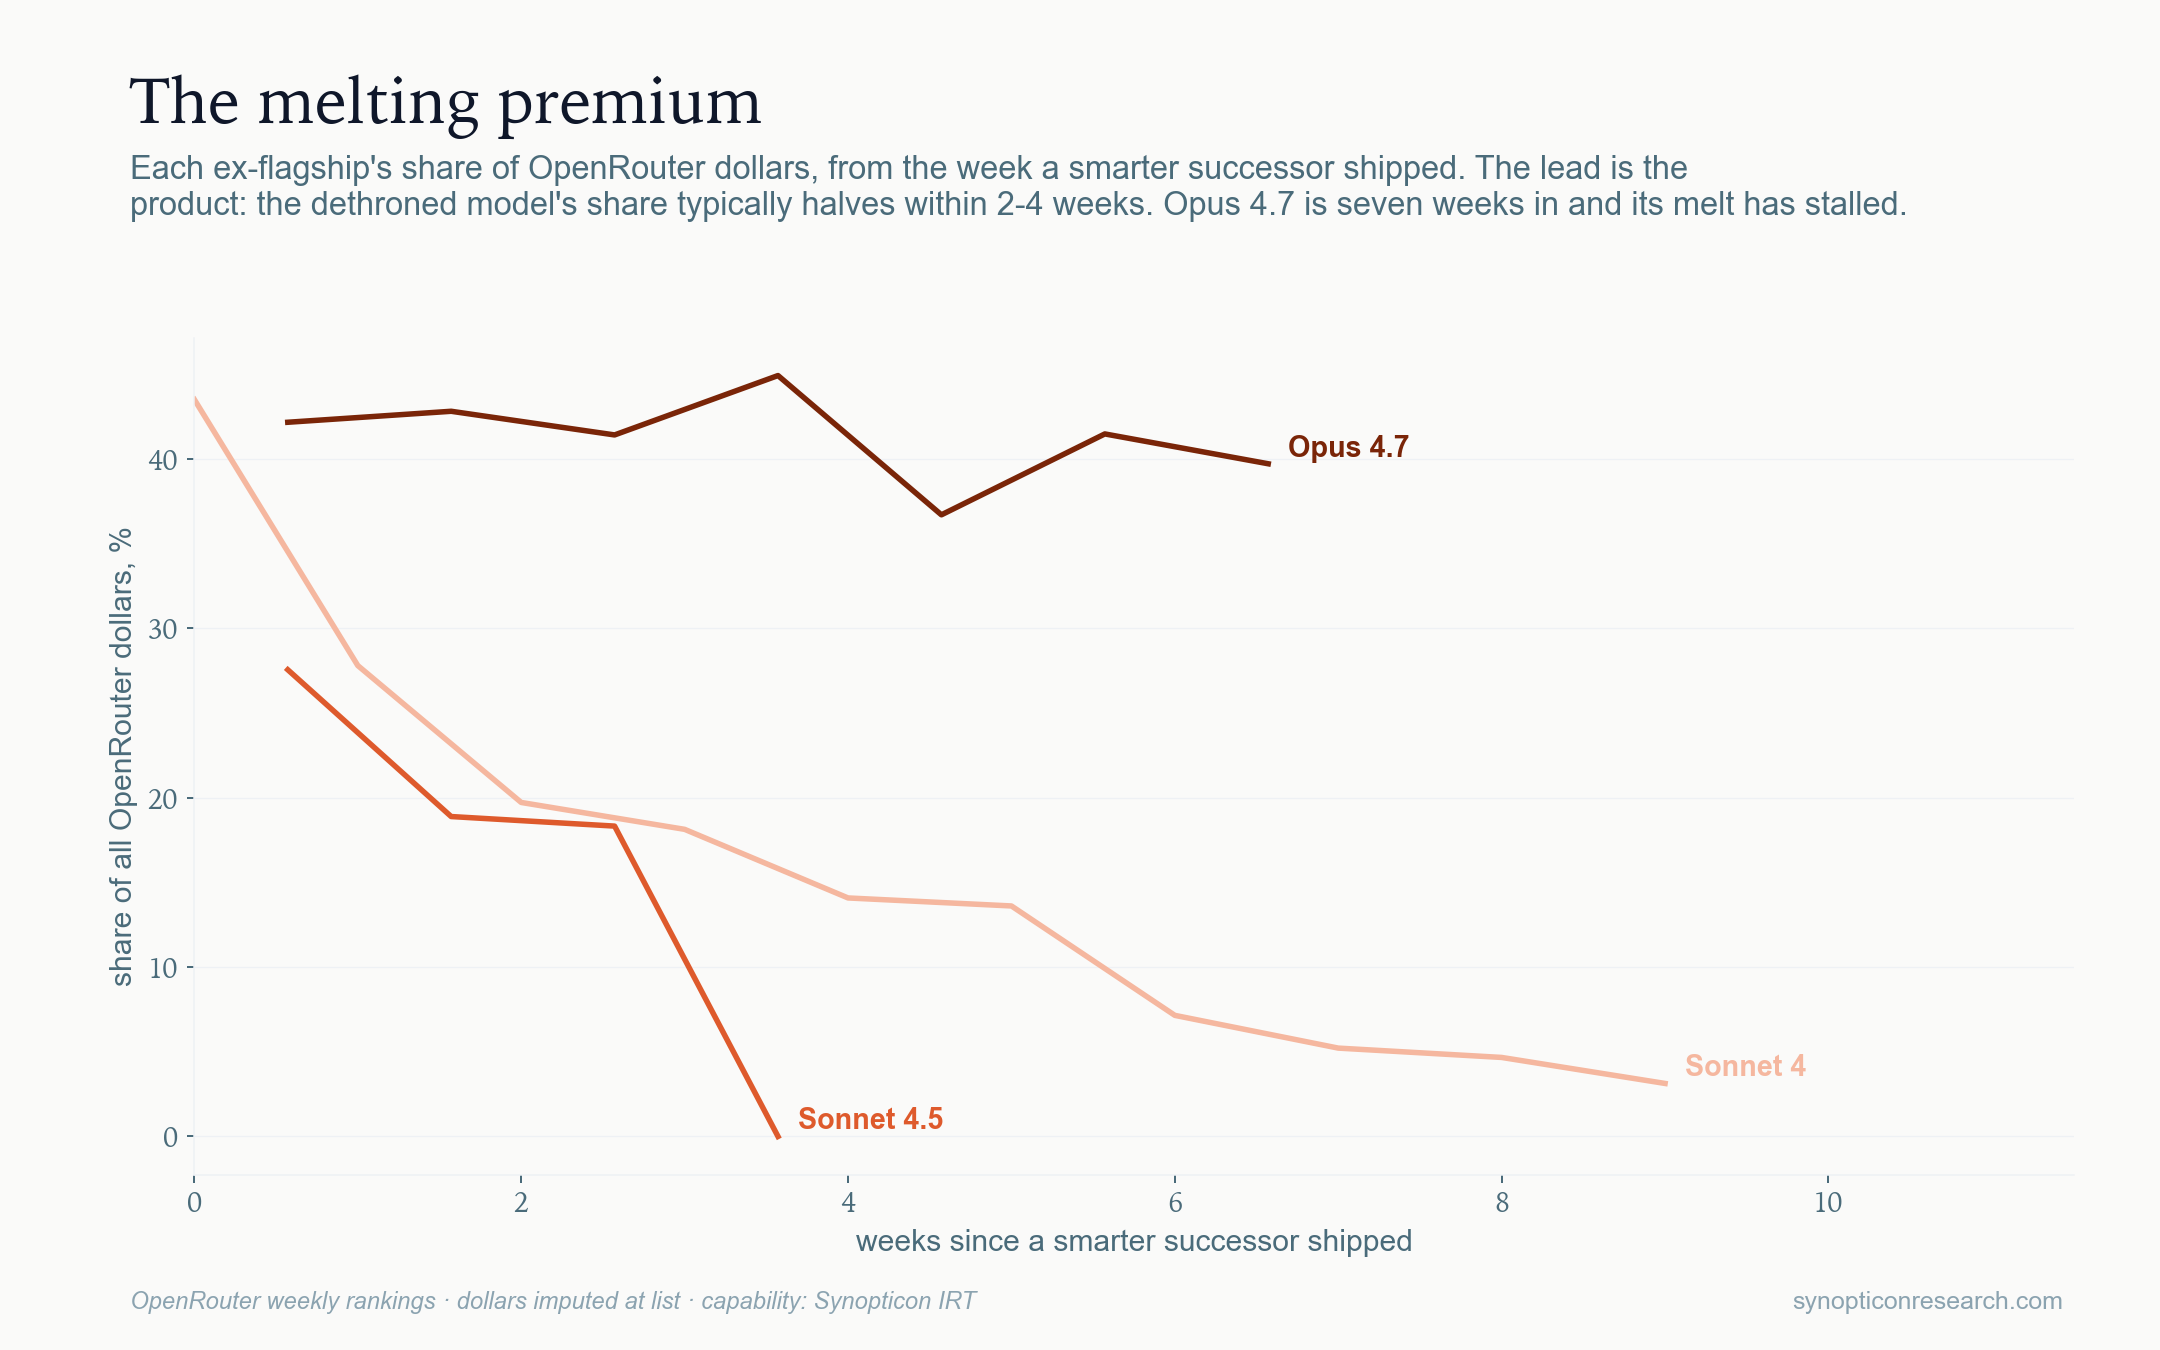
The bull case has one more fact to survive: the position is perishable. Track every dethroned flagship from the week its successor shipped: its share of dollars typically halves within two to four weeks. The $13M-a-month position is a lease. It expires the day someone ships a smarter model, usually from your own research team.
Opus 4.7 is the live experiment: seven weeks after 4.8 shipped it still holds 40%, and its melt has stalled. Migration takes time when the successor is close in capability, and the durable asset is the succession rather than any single model.
The named test: GLM-5.2 vs Opus 4.8
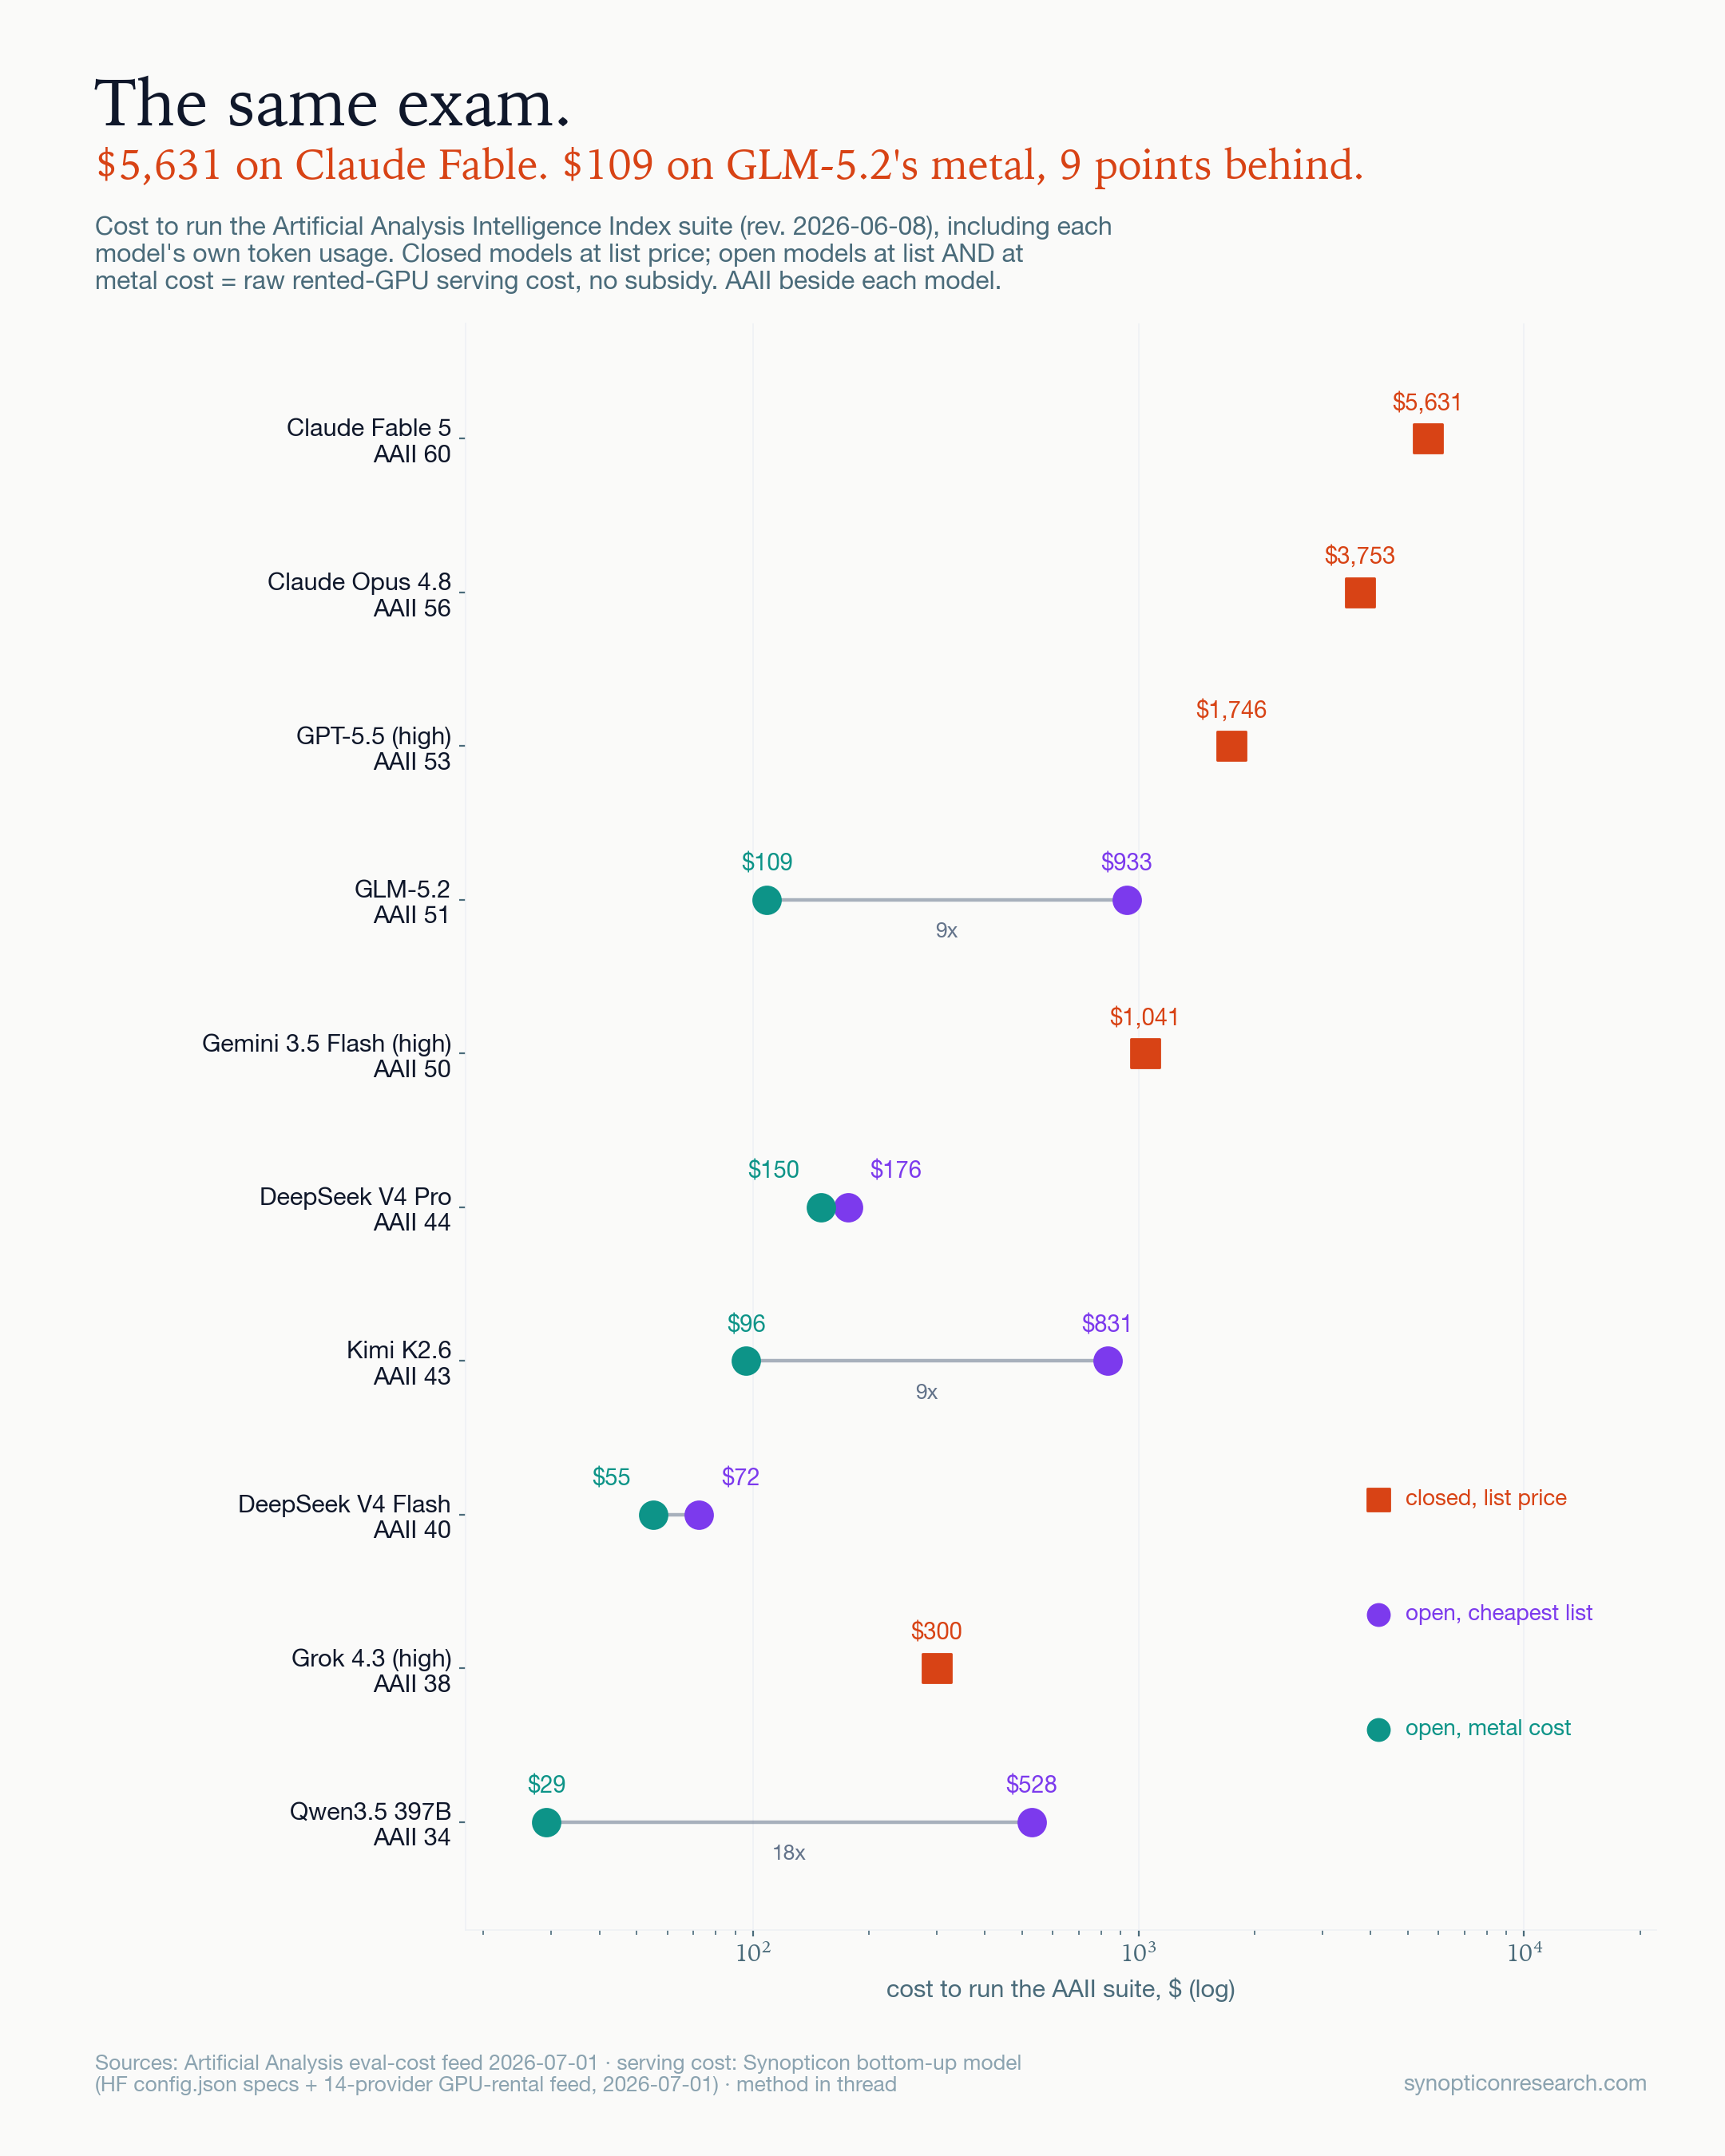
GLM-5.2 is the ceiling argument made flesh: 94% of Opus 4.8's capability on our index, open weights, and about a sixth of Opus's realized per-token price. Running the whole Artificial Analysis index costs $109 on rented GPUs versus $3,753 on Opus at list. (Claude Fable 5, at the top of the exam chart, has not entered OpenRouter's observable rankings in this window; the reign on this channel belongs to Opus 4.8.) The market verdict so far. Opus 4.8 averages $11.5 million a week on OpenRouter at a realized $7.00 per million tokens. Kimi K2.6, the other open flagship, ran six weeks at $1.4 million a week and then dropped out of the observable rankings entirely; it has not appeared for seven weeks. GLM-5.2, five weeks in, earns $3 million a week and is still climbing, the strongest open-weights debut in the window; whether that ramp bends the pattern is part 2's question. The discount is real. So far the dollars walk past it, up the capability ladder. What they walk toward is a bundle: capability plus trust, reliability, and harness integration (we measured the wrapper layer in The Harness Moves the Score). This piece cannot decompose that bundle. The point is that the bundle exists only at the frontier.
Fifteen months of the same verdict
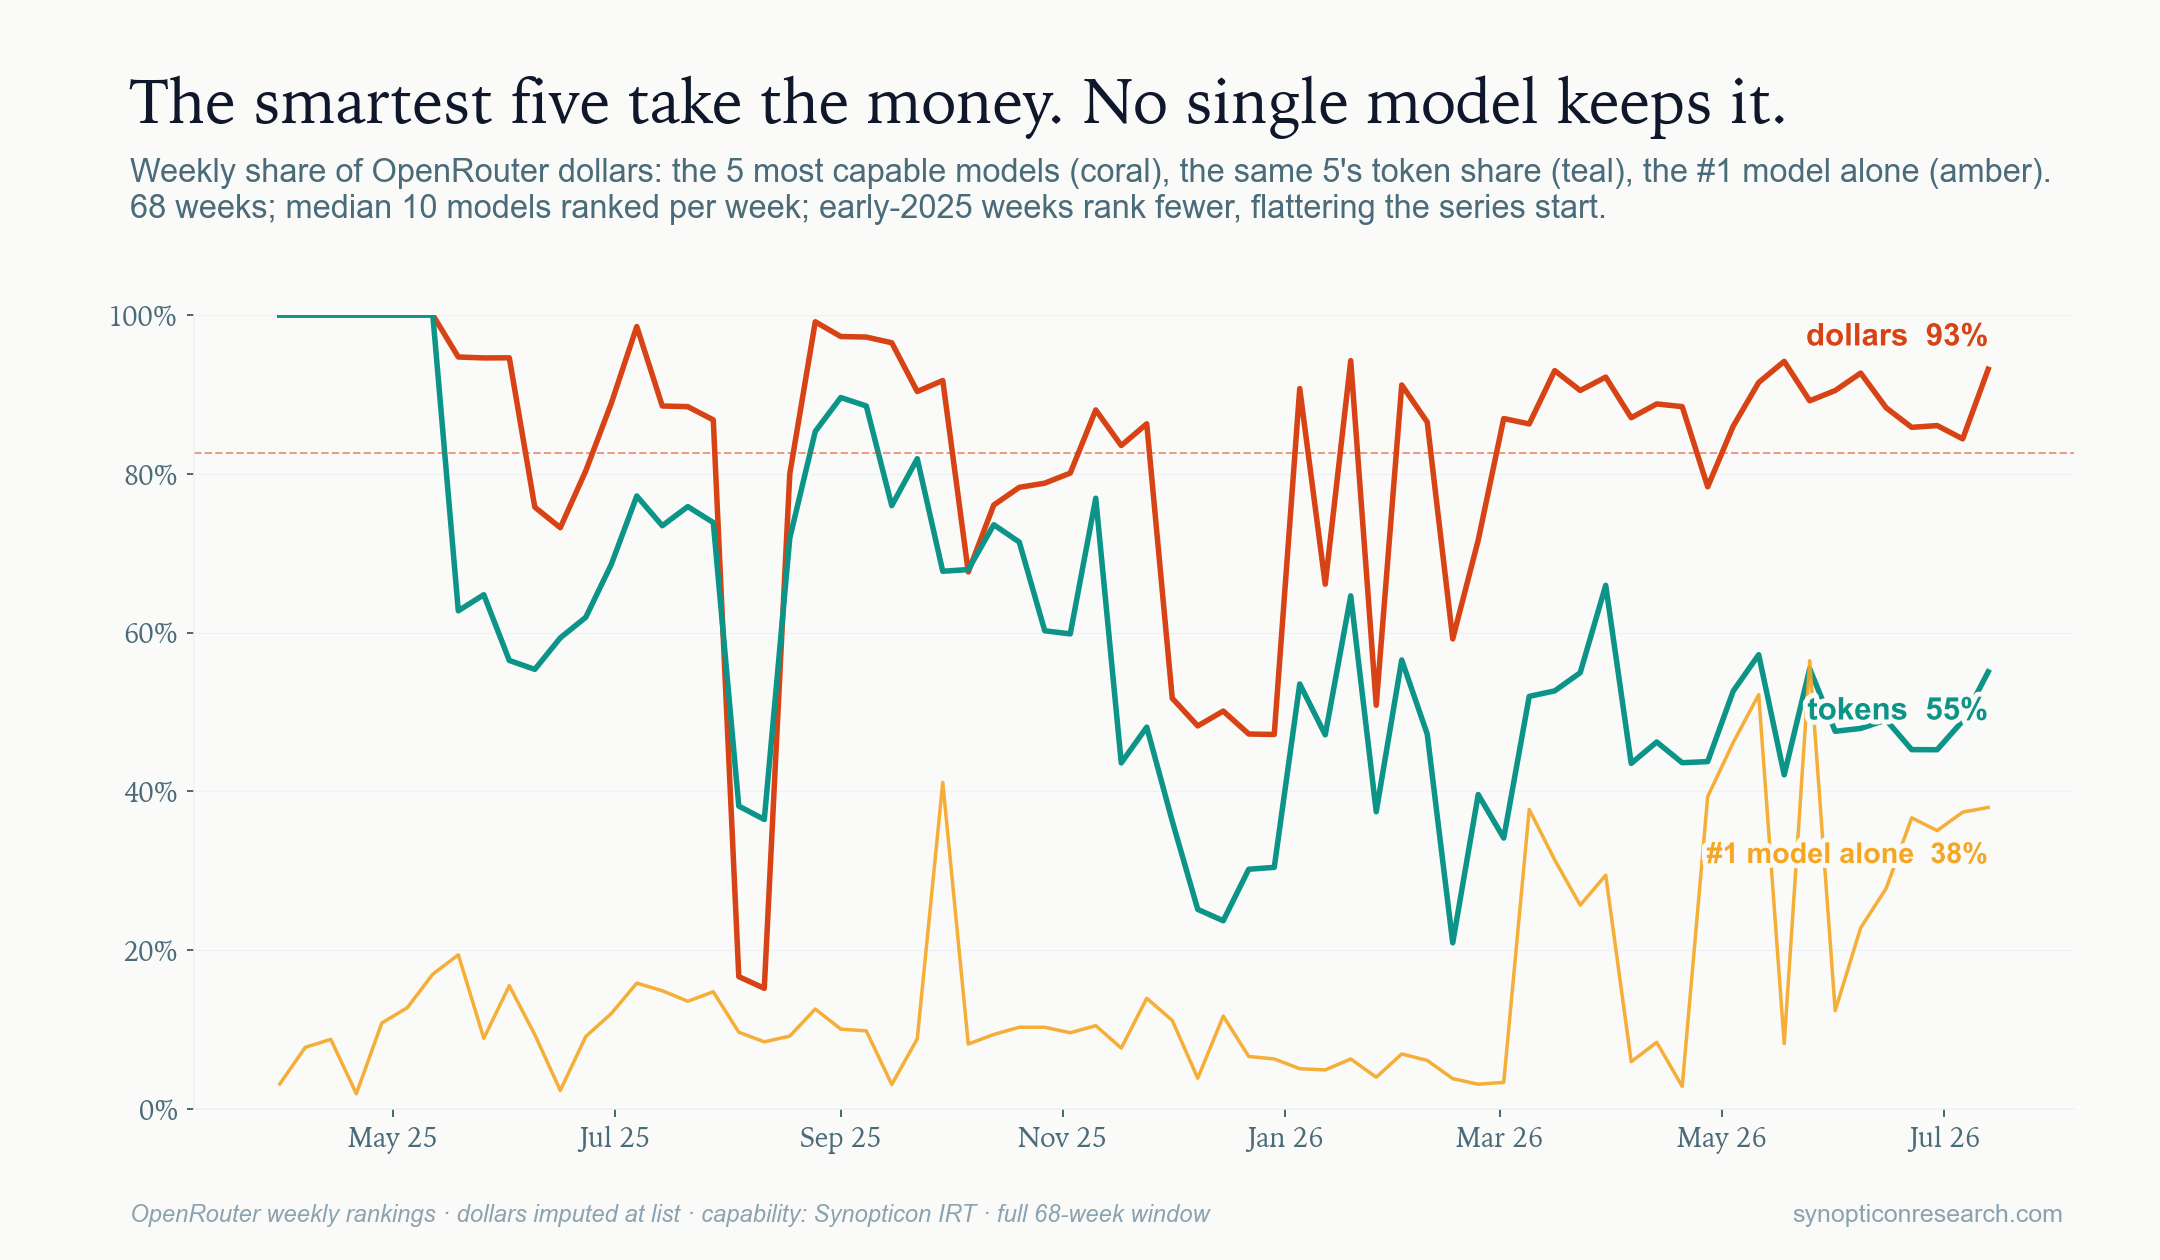
Is this a snapshot artifact? We tried to break it. Our first framing (dollar share within 2% of the best) failed its own stability test, swinging from 2% to 93% with the release cycle, so we replaced it with one that cannot breathe: the five most capable models available each week, whoever they are. Those five took a mean 86% of all dollars across the full 69 weeks, every quarter between 72% and 100%, and 82% so far this quarter (the latest week: 72%). No secular erosion. The names rotate constantly; the concentration never does.
The single most capable model, on its own, averages 16% of the dollars and swings between 2% and 56% with each release cycle; it sits at 38% today, seven weeks into Opus 4.8's reign. And the ranked set is small, a median of ten models a week, but that cuts against the objection rather than for it: the same five models move only 55% of the tokens. Buyers spread their work down the ranking and concentrate their money at the top of it.
The enterprise check: real billed dollars, OpenAI included
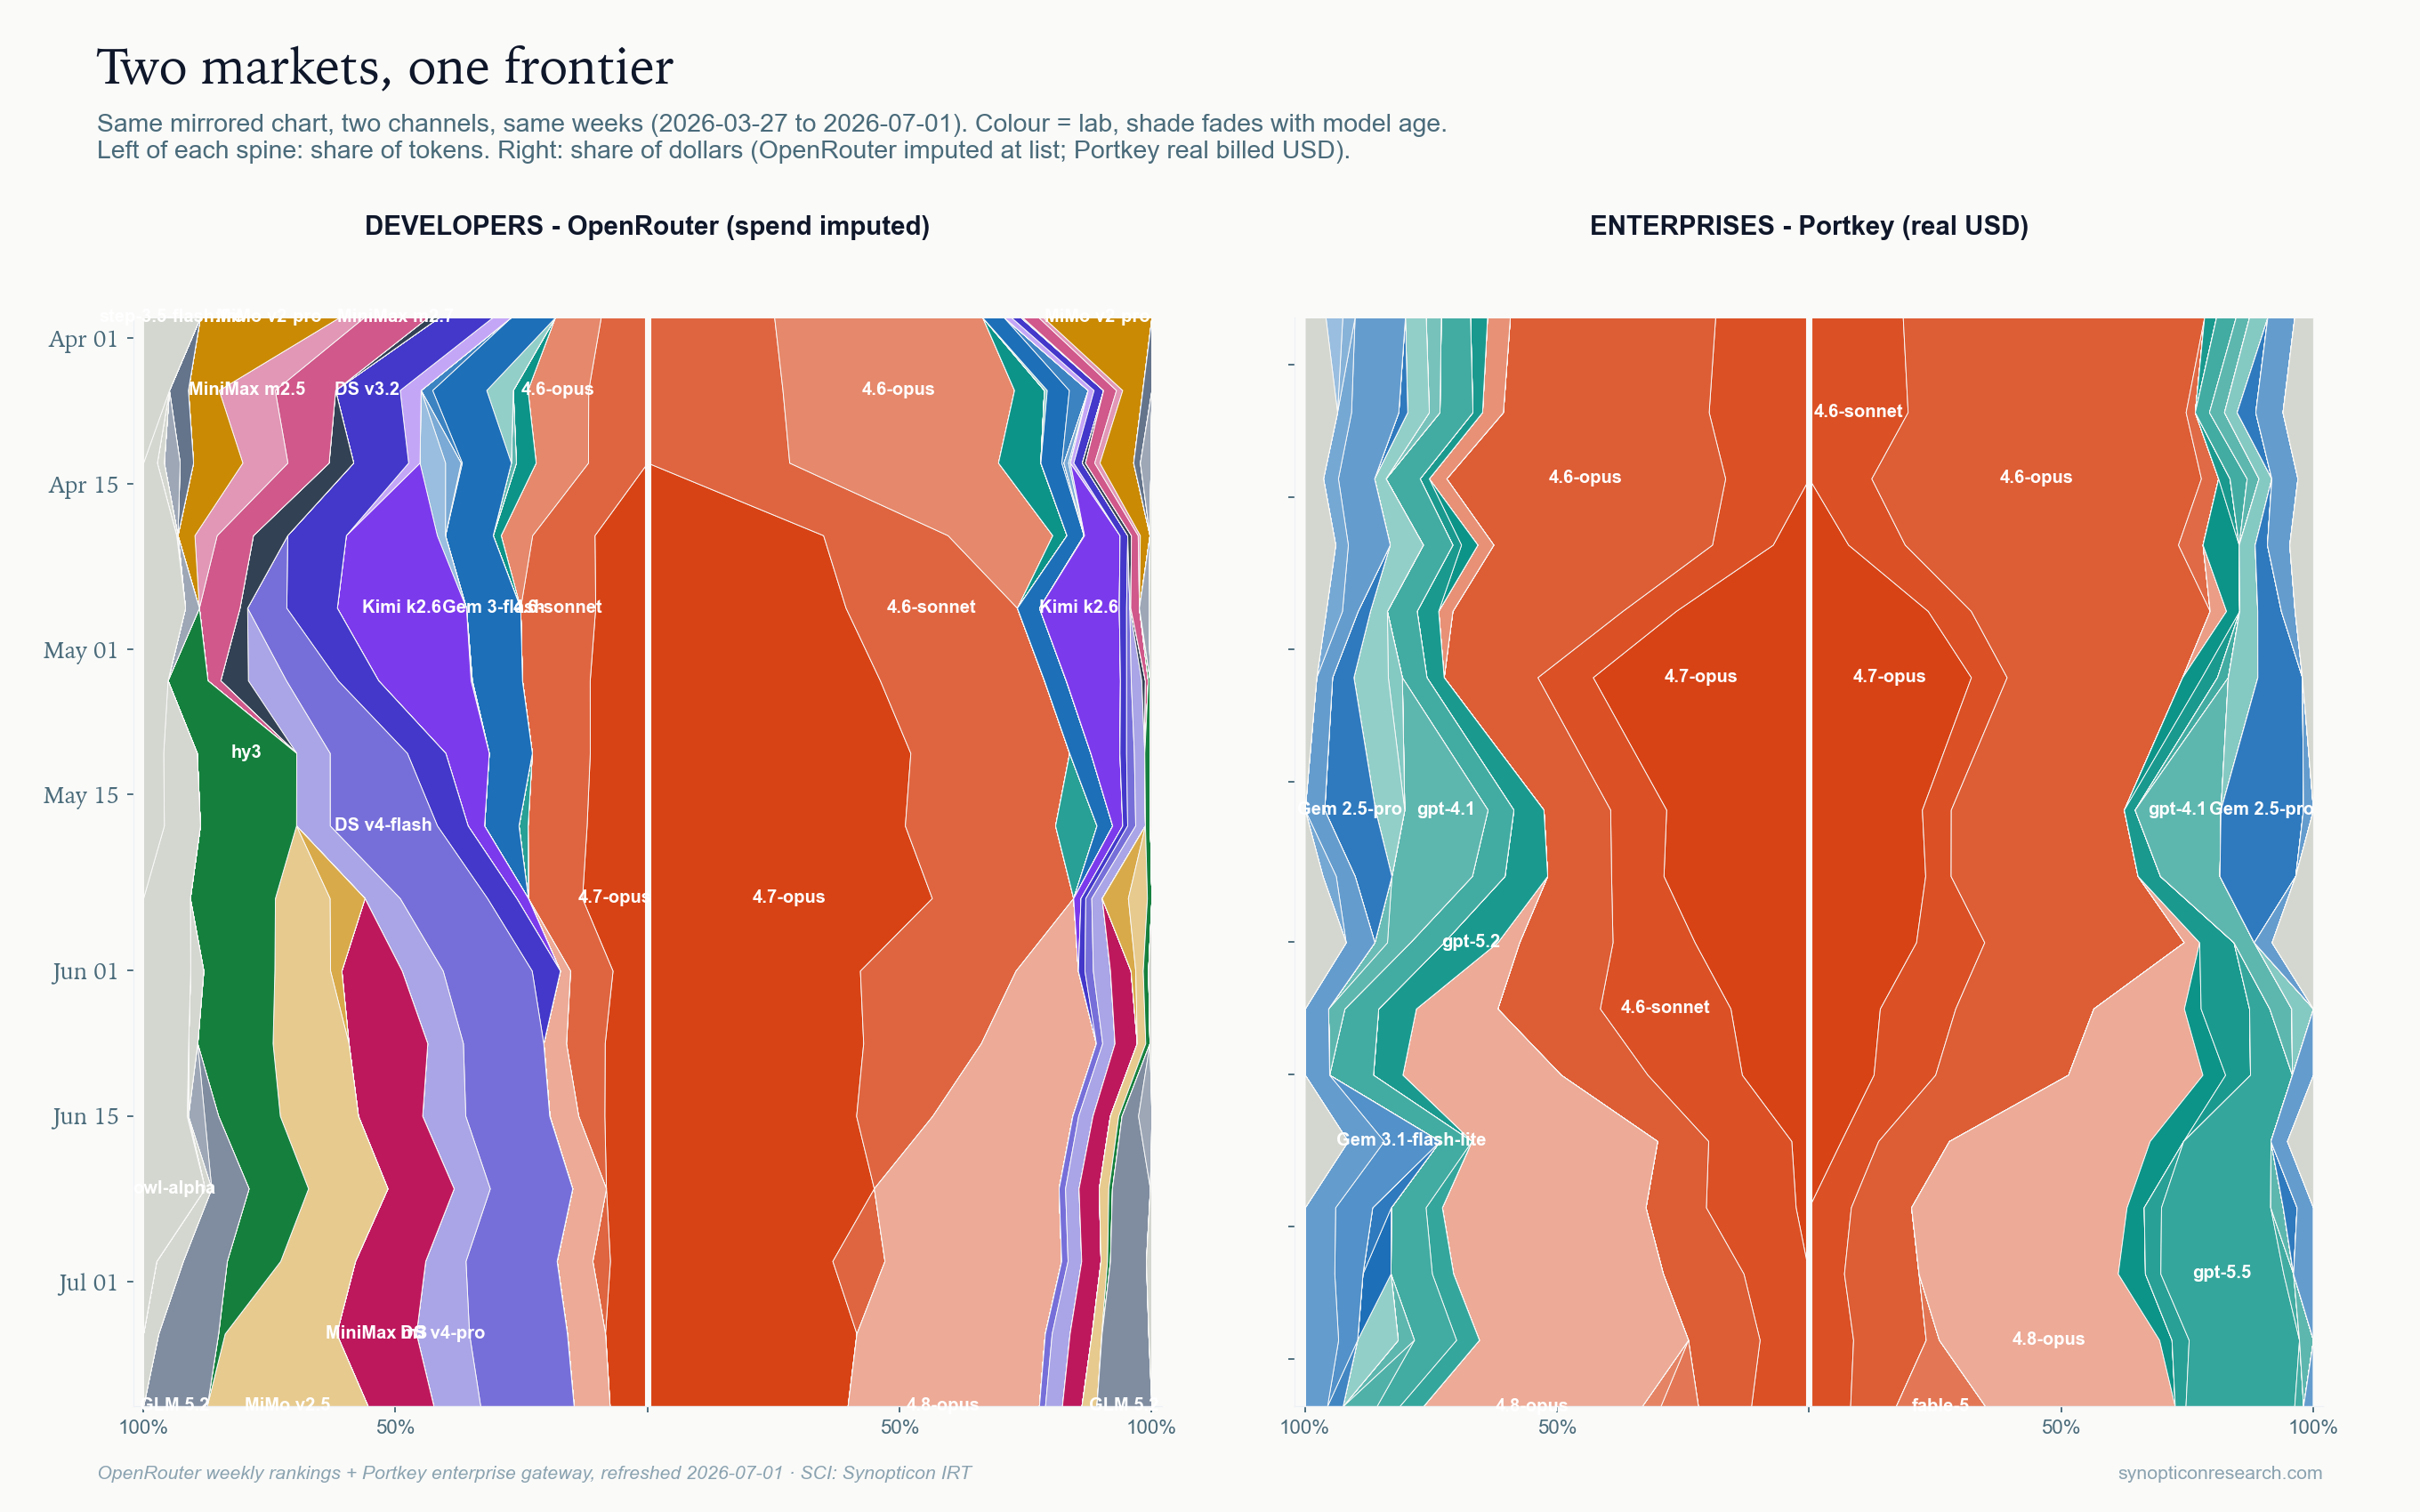
Every number above comes from a developer channel where dollars are imputed and OpenAI barely appears. The enterprise gateway removes both objections at once: real billed dollars, OpenAI present. The verdict holds: 48% of enterprise spend sits within 2% of the best and 88% within 5%; enterprises barely buy below the frontier at all. Developers arbitrage the premium, moving cheap tokens while their dollars go to the frontier. Enterprises simply pay it.
Why this matters

Hundreds of billions of dollars are currently priced on the answer to this article's question. If intelligence is a commodity with a ceiling, frontier labs are burning historic capex to rent a lead that stops mattering. If marginal intelligence carries premium value, the lead is the entire business. Fifteen months of buyer behaviour across two channels says the second, with a shape nobody's slogan captures:
- The premium is real and threshold-shaped. 6-13x per token, 10-17x per model, paid only at the frontier. Below it, measured capability goes unpaid.
- The premium is perishable. It halves in weeks when the crown moves. Buyers are paying for a standing promise: the next model will be the best one. The durable moat is the cadence of the succession, and the half-life above is what happens whenever it slips.
- The bear case has a precise falsification condition. For "95% as good for 10% the price" to win, buyers must start treating near-frontier as frontier. Watch the top-5 dollar share (86% for sixteen months). The week that line breaks downward and stays broken is the week the ceiling argument starts being true. GLM-5.2's five-week ramp is the first candidate signal; Kimi K2.6's six-week run ended with it dropping out of the rankings, which is what churn looks like. Claude Sonnet 5 ($2/$10 promotional) and GPT-5.6 shipped in the final two weeks of this window; neither has cracked the observable rankings yet. Their entry, erosion or churn, is part 2.
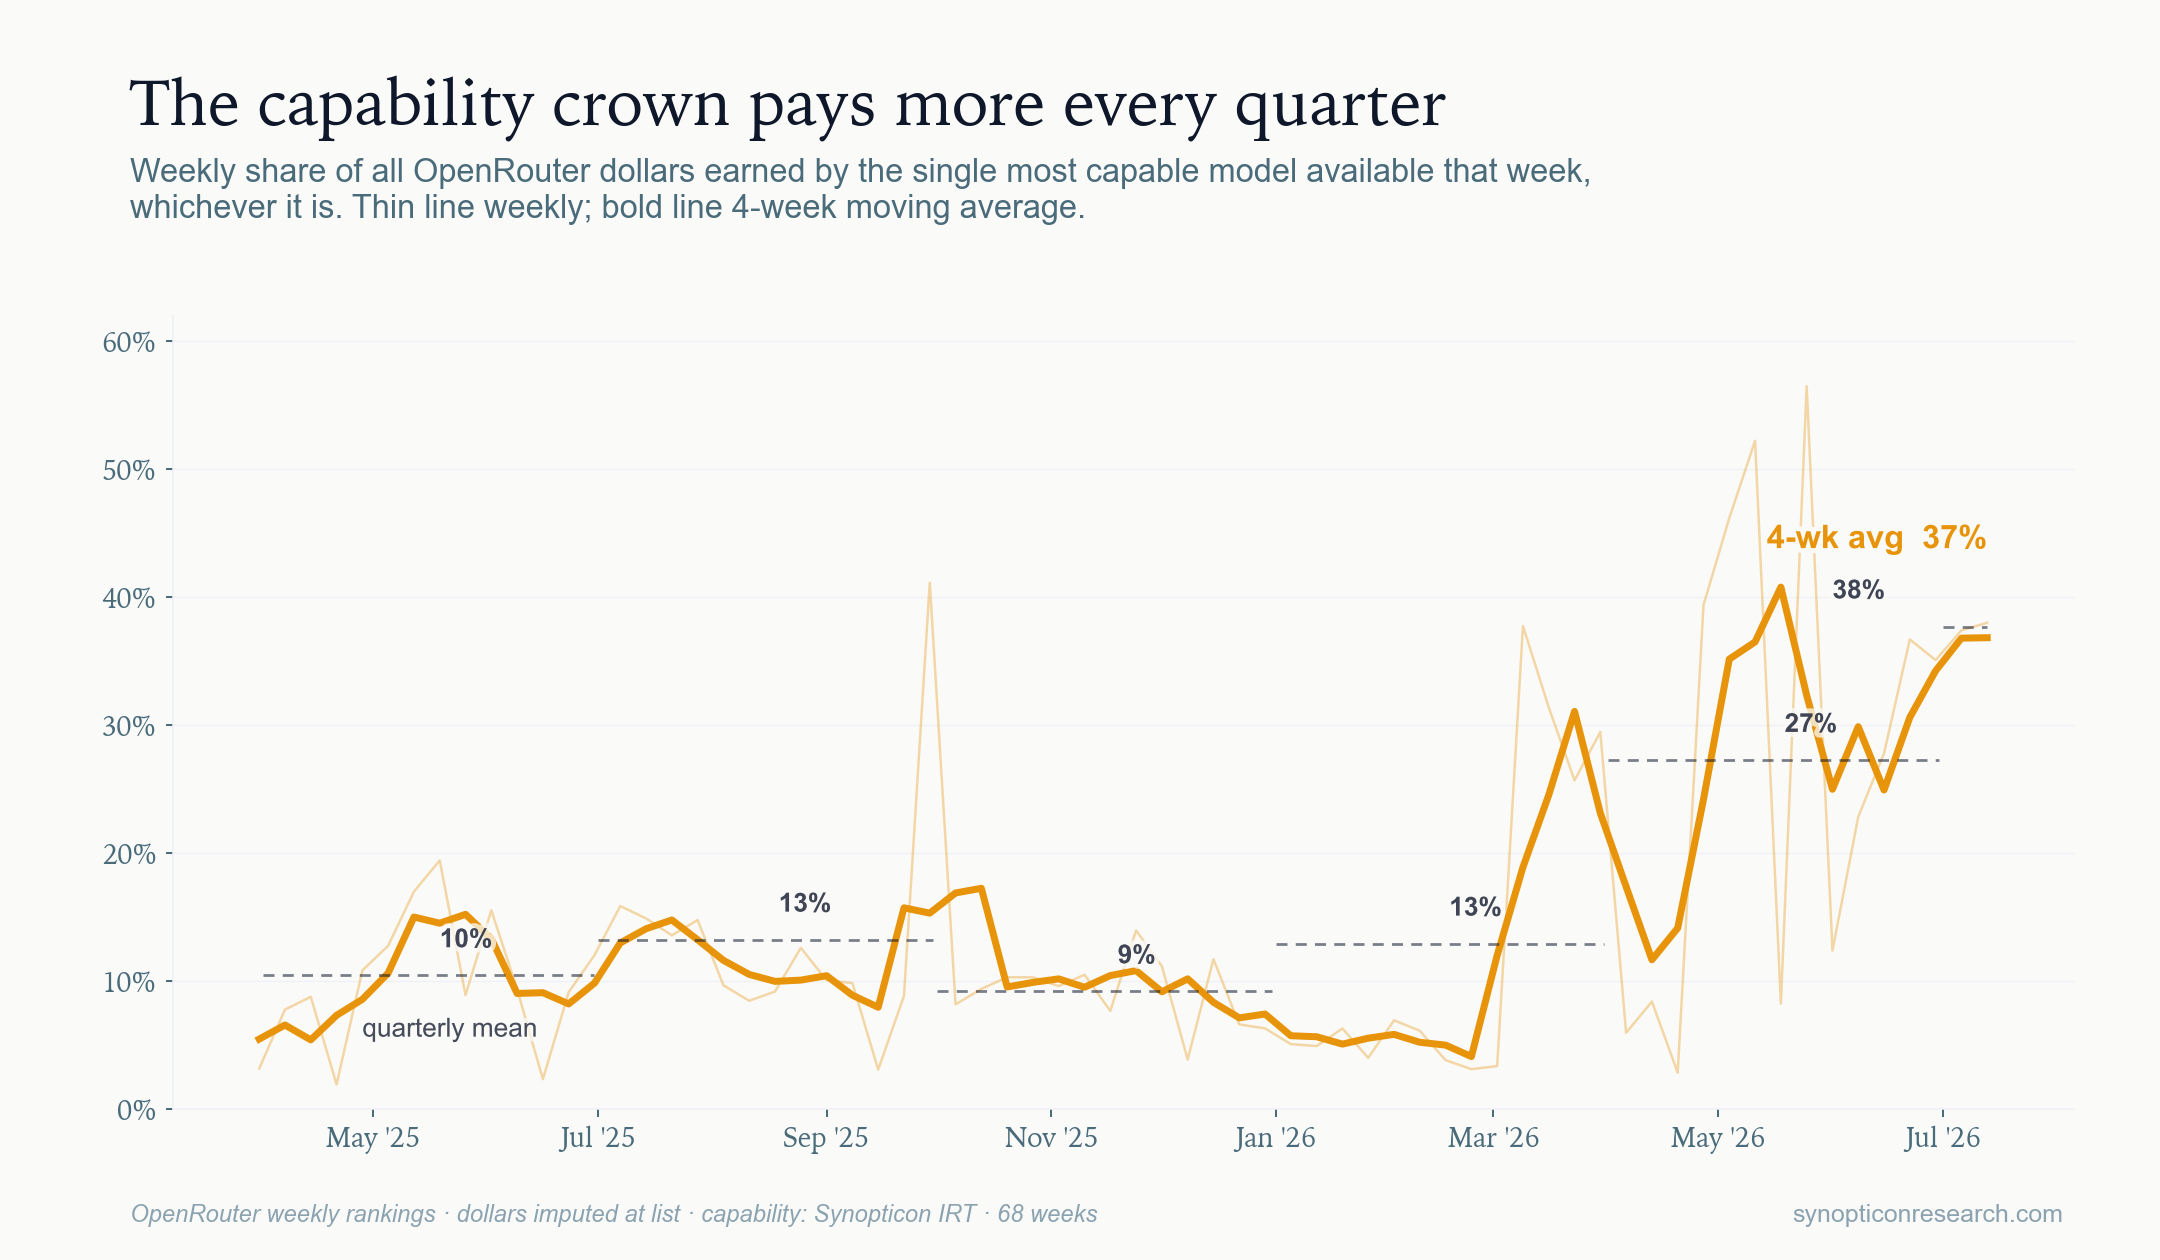
One closing exhibit. The most capable ranked model's share of this channel's dollars, smoothed, with the crown's succession above it: worth ~10% through the third quarter of 2025, between 24% and 34% every quarter since, and a 44% four-week average today. Read the ribbon against the line and the sharper pattern appears: in Anthropic-crowned weeks the leader averages 46% of spend; in anyone else's, 8%.
The sovereignty crowd is right about the discount and wrong about the marginal buyer. The money, developer and enterprise alike, keeps choosing the last two points of intelligence over an 80% discount, month after month, at better than a thirty-to-one exchange rate for marginal capability. Until that changes, the frontier is the market.
Methodology & limits
- Dollars on OpenRouter are imputed (tokens × list); real per-model USD ended Jan 2025. Claims are class-level. List prices also ignore enterprise volume discounts, so absolute dollar levels for the largest sellers are likely overstated; the tiering is about ranks and shares, which discounts compress far less. Portkey's real billed dollars replicate the tiering (10x per-model) with zero imputation.
- Observation window: OpenRouter surfaces each week's top models (median ten ranked per week); the long tail is bucketed. The #1-model series is noisy in thin-ranked weeks; its claims ride the moving average and quarterly means. "Extinct" = absent from observable rankings. Portkey publishes a top-15. Early-2025 weeks rank fewer models, flattering the start of the stability series.
- Capability convention: each family at its best-scored IRT row; top ~35 slugs hand-audited (gpt-5.5 ≠ GPT-5.5-Pro, glm-5 ≠ GLM-5-Turbo). One framing (within-2% band) was replaced after failing its own stability check; the failure and the fix are described in the text.
- Capability is not the whole premium. MiMo v2-pro sits in the frontier band on measured capability at a fraction of the price and earns ~1% of dollars. Brand, trust, reliability, and harness integration ride on measured capability; our data cannot decompose them. The defensible claim: frontier capability plus frontier brand captures the value.
- Correlation caveats: revenue and intelligence-per-dollar both contain price; headline tests are share comparisons and token-side statistics, not coefficients.
- Publish-week snapshot: rankings week of 2026-07-20 (fetched 2026-07-21), capability scores as of 2026-07-23. Tier means carry small samples and move with each refresh, so point-value figures are quoted at stable resolution: the frontier marginal holds near $3M per point across refreshes, the mid-pack marginal stays under $100k, and the ratio is a floor.
- AAII revision 2026-06-08 throughout. Serving-cost model
carries ~2x uncertainty, biased toward overstating the open floor.
Sources:
sources/PROVENANCE.md.